When neuroscientists decide to analyze literary texts, the results are strikingly different from those produced by traditional literary analysis. For instance, when Natalia Bilenko and Asako Miyakawa, two neuroscience PhD students at the University of California in Berkeley, decided to analyze three classic texts—J. R. R. Tolkien’sThe Hobbit, Haruki Murakami’s novel Kafka on the Shore, and Tennessee Williams’s play The Glass Menagerie—they came up with an unusual set of interactive online data visualizations.
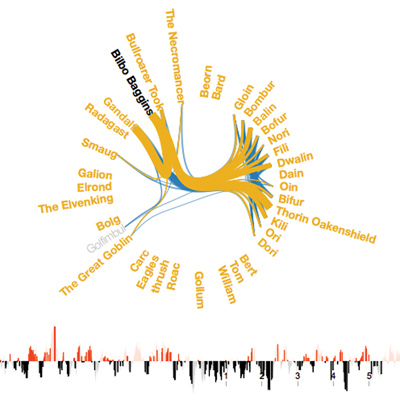
Completed in December 2013, their project, “Visualization of Narrative Structure” (nbilenko.com/projects/narrative.html), breaks down the emotional trajectory and character relationships of each of the three texts by chapter or scene. Characters are depicted like spokes on a wheel, their interactions represented as connecting lines. (In the below example, which depicts the opening chapter of The Hobbit, the most lines are seen between the main characters, Bilbo Baggins and Gandalf, and the cast of dwarfs introduced in the chapter.) The visualization also attempts to track the emotional valence of each sentence in the book via the graph at the bottom of each page (red reflects positive emotion, black denotes negative). A user can hover the mouse over any line on the graph and read the corresponding sentence of the book.
“We are not trying to reduce literature to something impersonal and quantitative,” say Bilenko and Miyakawa. “Indeed, we know, through working on the project, that texts are so much more multifaceted and complex than we can capture in one graph.” The visualizations instead offer a sort of bird’s-eye view of a work. “The experience of reading a book is almost always linear and sequential,” note Bilenko and Miyakawa. “We wanted to create a visual way to capture and explore some aspects of the emotional landscape in a story.” Stay tuned: Bilenko is working on a new version of the project that will allow users to generate graphic visualizations of their own texts.


